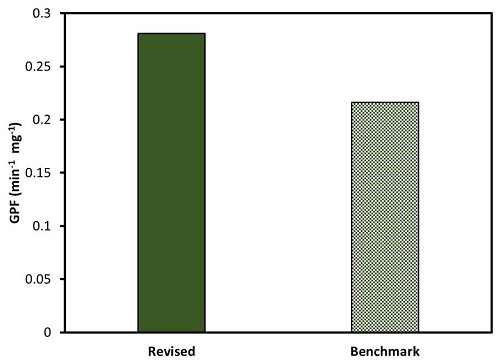
Figure 9: GPF for the revised and benchmark samples containing 0.113 g and 0.129 g of TiO2, calculated based on the methyl orange degradation rate constant after 1000 h of UV exposure and the mass of TiO2 lost during the 1000 h exposure time.