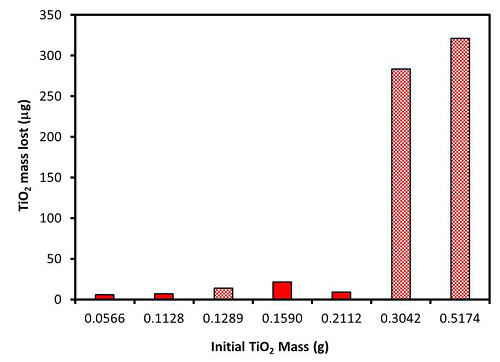
Figure 7:
The mass of titania lost from each sample type during the 2 h initial photocatalytic use of each sample type. Checkered bars represent benchmark samples, and solid bars represent revised-fabrication samples.