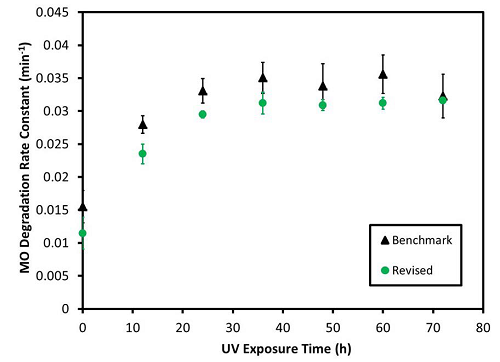
Figure 4:
Methyl orange (MO) decolorization rate constant as a function of the UV exposure period for each sample type with comparable TiO
2
content. The error bars represent one standard deviation from triplicate samples.