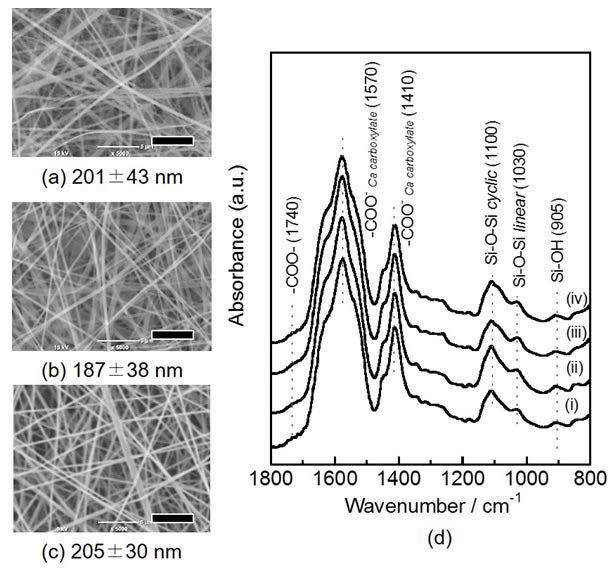
Figure 5: Results of characterisation of the fibre mats encapsulating fluorescent molecules by (a–c) SEM and (d) ATR-FTIR and average fibre diameters measured with SEM images. (a) fluorescein, (b) FITC-1000 and (c) FITC-2000. (d-i) O-2G, (d-ii) FITC-2000, (d-iii) FITC-1000 and (div) fluorescein. Bar in SEM images: 5 μm.