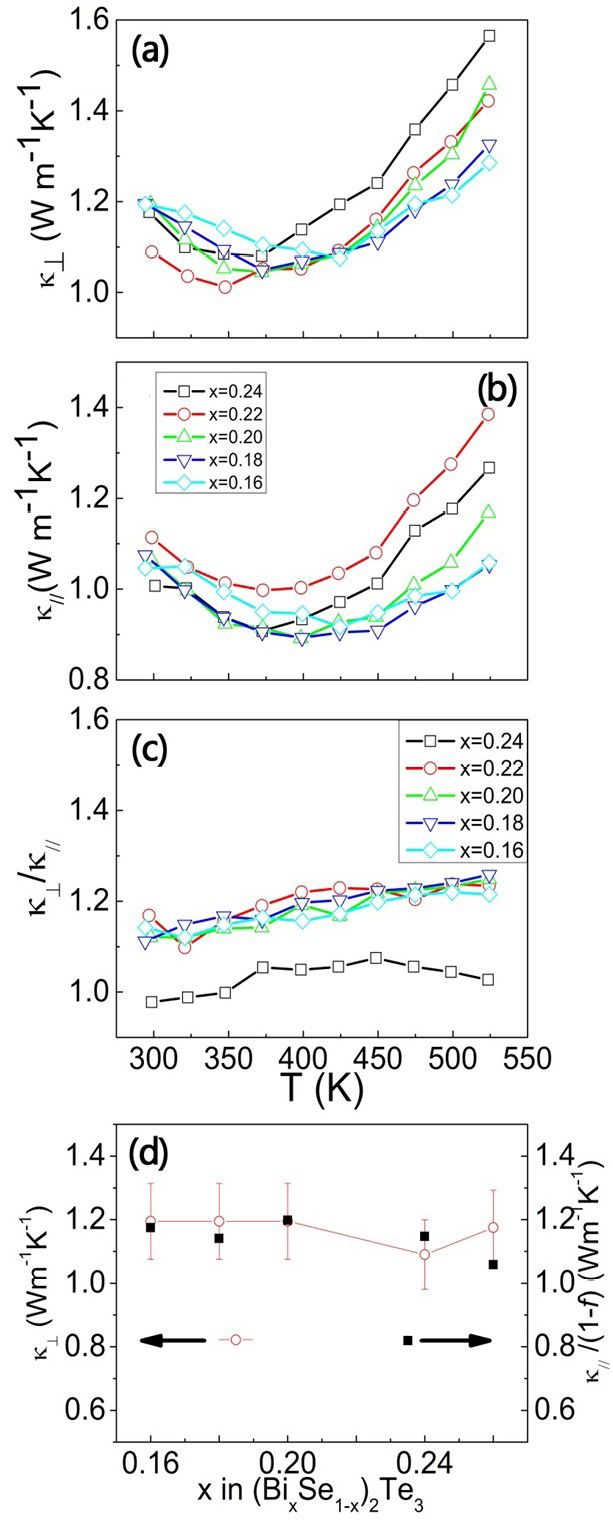
Figure 6: The plot of (a,b) thermal conductivity (k ⊥ , k // ) , (c) ratio of k ⊥ , k // with temperature, (d) plot of k ⊥ and k // / (1-f) with x in (Bi0.16Sb0.84)2Te3.