Figure 1:
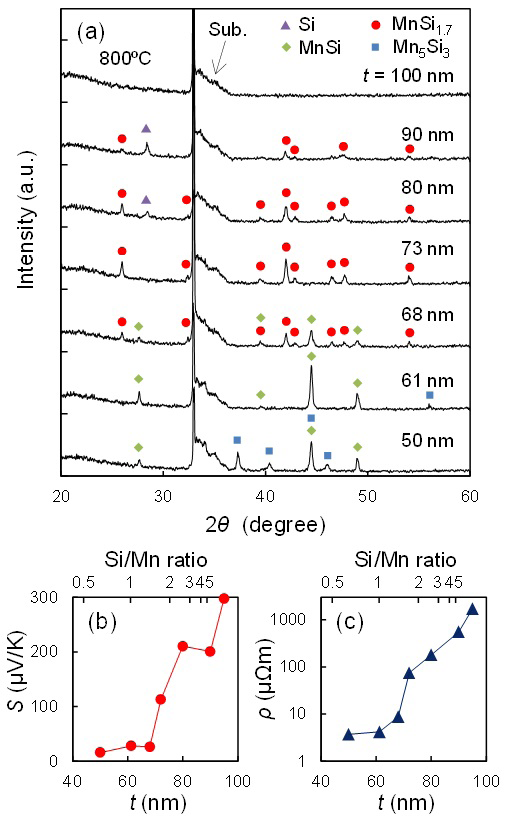
(a) XRD profiles of SiO
x
//[Mn(100–t)/Si(t)]
1
annealed at 800°C under vacuum. (b) Dependence of S on
t
. (c) Dependence of ρ on
t
. Corresponding Si/Mn composition ratio is also shown.