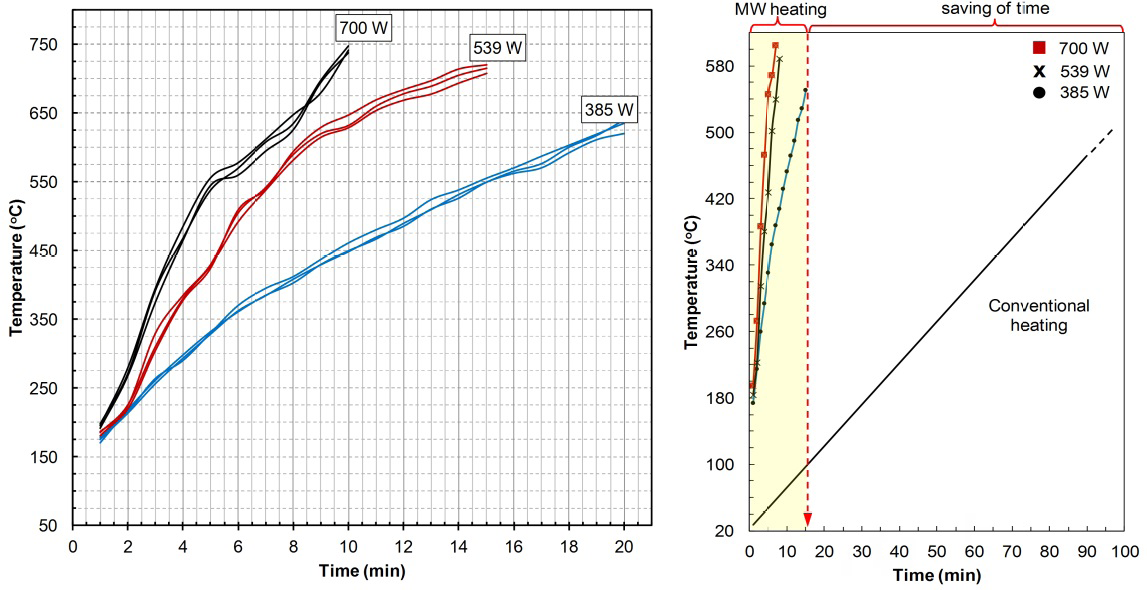
Figure 2:
(a)Verification of temperature-time plots for different power levels and (b) comparison of conventional.