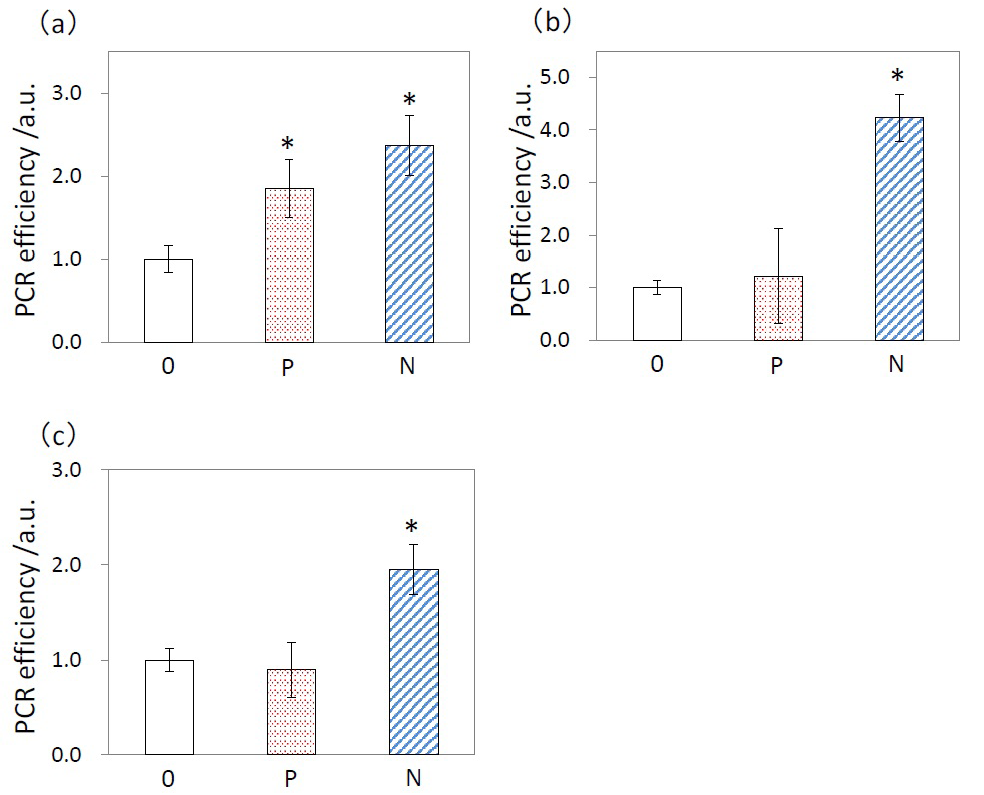
Figure 5: Quantitative real-time RT-PCR measurements of (a) Wee1, (b) GADD45A, and (c) CDKN2A mRNA levels in SK cells that were grown on N- surface (blue shaded area), P- surface (red spotted area), and 0-surface (white area) of hydroxyapatite. Results are the mean ± standard deviation (N = 4).
*: P < 0.05, compared with 0-surface. GAPDH was used as a control.
*: P < 0.05, compared with 0-surface. GAPDH was used as a control.