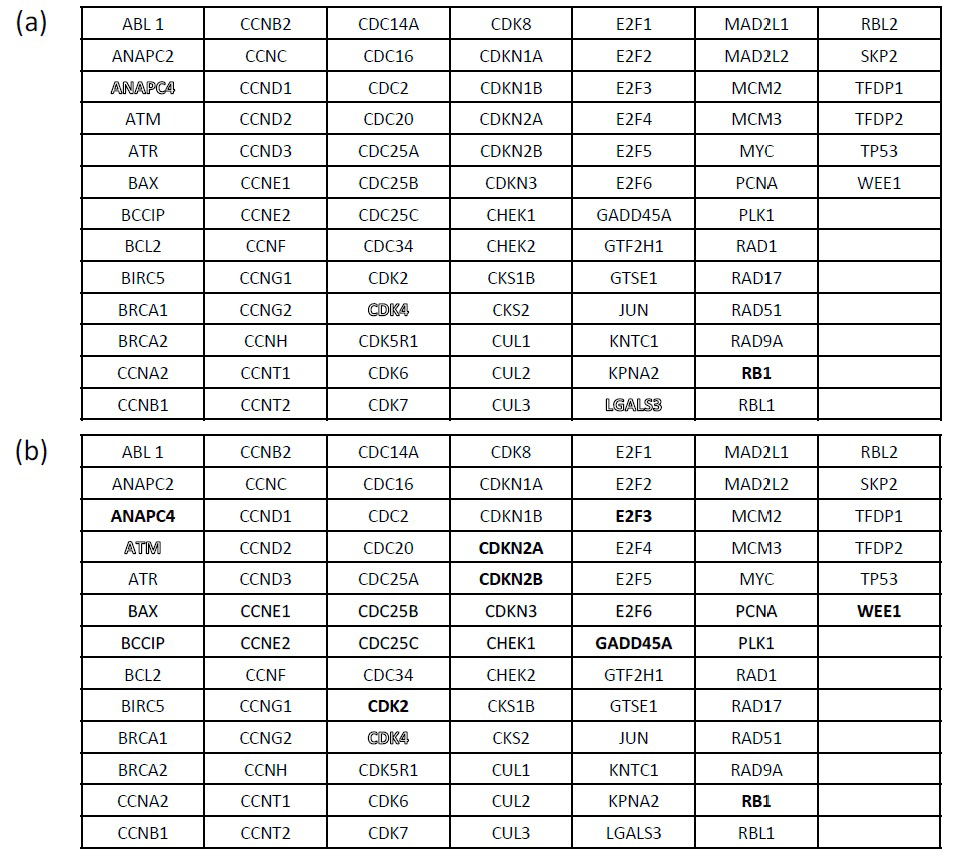
Figure 4: RT-PCR array for cell cycle-related genes on (a) N-surface and (b) P-surface compared to 0-surface after normalization with GAPDH. The names of genes that showed increases greater than 1.75-fold are indicated with bold font. Genes with decreases to less than 0.75-fold are indicated with white bold.