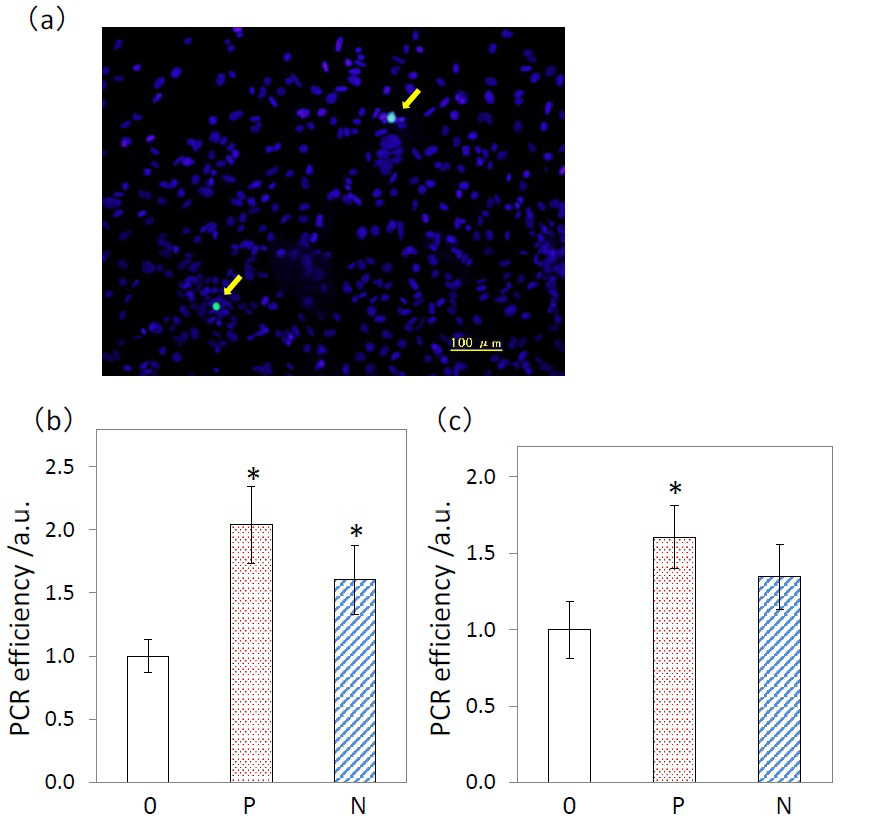
Figure 3: (a) A representative image of SK cells cultured on the polarized hydroxyapatite with TUNEL staining indicated by arrows. DAPI was used as a nuclear counterstain. Scale bar, 100 μm. Quantitative real-time RT-PCR analysis of (b) calponin and (c) caldesmon mRNA levels for evaluating the differentiation of SK cells on N- surface (blue shaded area), Psurface (red spotted area), and 0-surface (white area) of hydroxyapatite. Results are the mean ± standard deviation (N = 4). *: P < 0.05, compared with 0-surface.