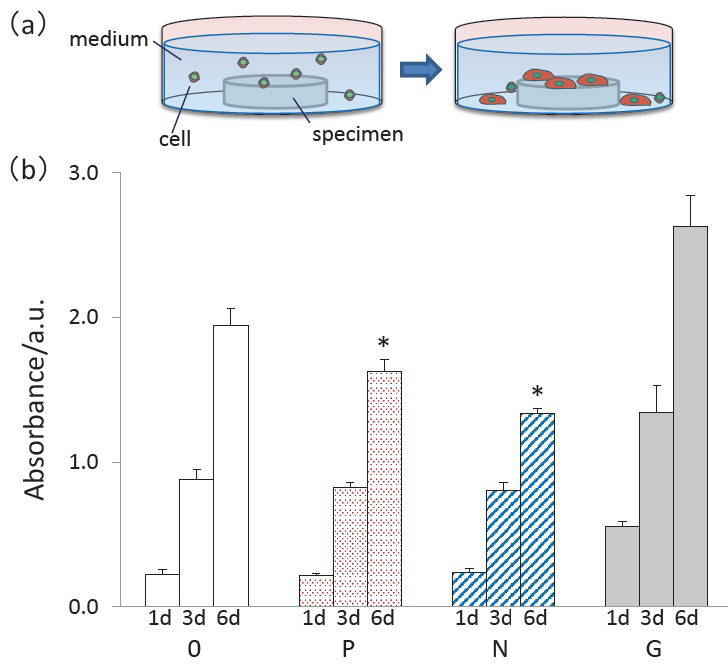
Figure 2: (a) Schematic diagram of SK cell culture on a specimen. (b) MTT assay at 1, 3, and 6 d after seeding on N- surface (blue shaded area), P- surface (red spotted area), and 0-surface (white area) of hydroxyapatite and glass surface (G, gray area). Results are the mean ± standard deviation (N = 4). *:P < 0.05, compared with 0-surface.