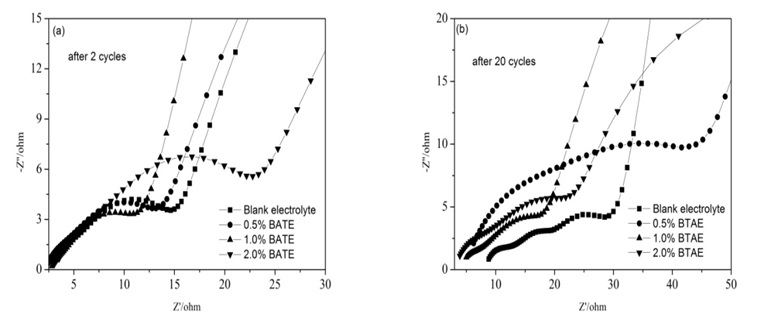
Figure 3:
Nyquist plots of cells in electrolytes with different concentrations of BATE: (a) after 2 cycles; (b) after 20 cycles.