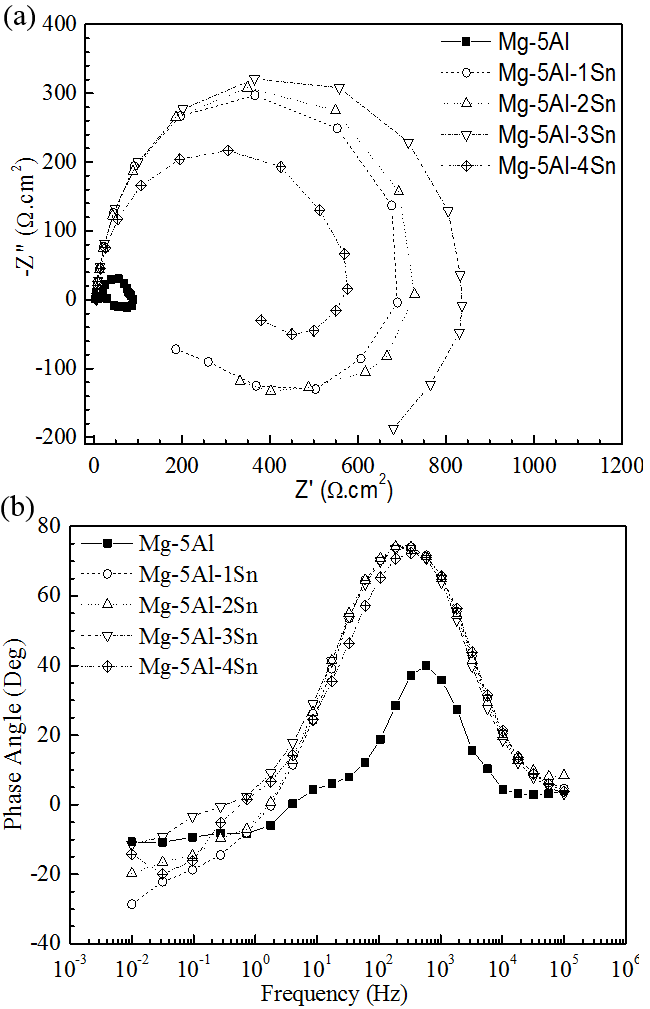
Figure 4:
Impedance spectra on (a) Nyquist plots and (b) Bode plots.