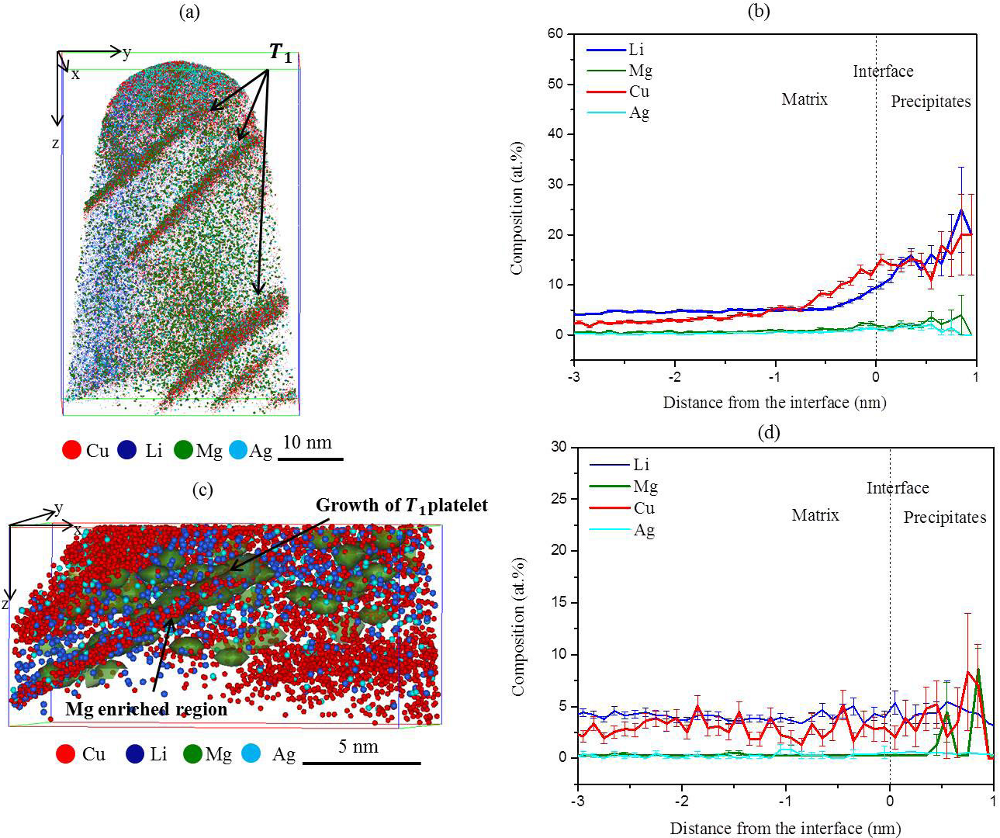
Figure 9: LAWATAP analysis of the sample in T6 condition.
(a) The reconstructed volume of the microstructure shows a uniform distribution of the T1 platelets, with an average thickness of (4.7± 1) nm and an average length of (40± 2) nm.
(b) A combined proxigram profile corresponding to the T1 platelets, which are delineate by 5 at.% Li isoconcentration surfaces, gives the average chemical composition as (15.7±1) at.% Cu, (16.6±2) at.% Li, (2.4±1) at.% Mg and (1.4 ±0.4) at.% Ag.
(c) An inhomogeneous distribution of Cu and Mg in the Al matrix indicates the growth of the T1 platelet in the Mg enriched region, which contains localized Ag atoms.
(d) Proxigram concentration profile quantifies the chemical composition of the enriched regions in (c) as (7.1±3) at.% Cu, (3.8±1) at.% Li, (4.7±1) at.% Mg and (0.5 ±0.2) at.% Ag.