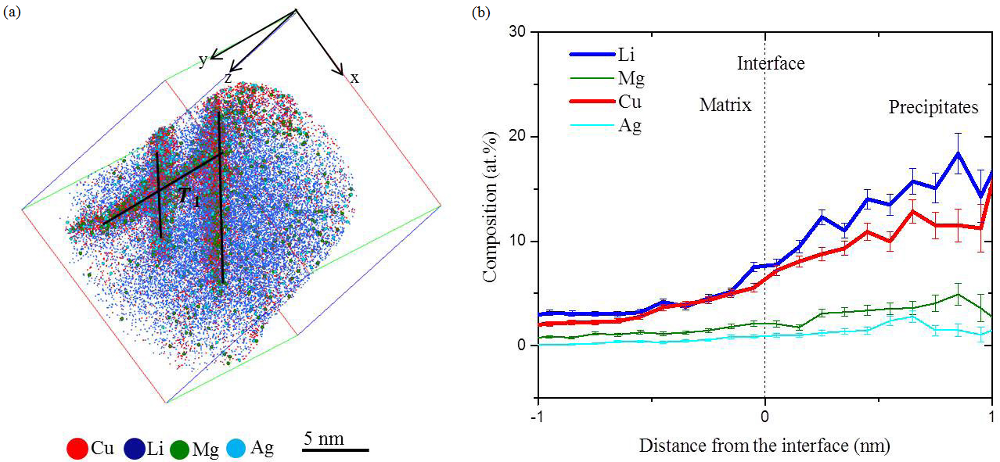
Figure 7: LAWATAP analysis of the sample following T8 heat treatment.
(a) The reconstructed volume shows the fine distribution of the T1 platelets with an average thickness of (1.4 ± 0.2) nm and an average length of (11.8 ± 2) nm, and intersect each other’s.
(b) The chemical composition as estimated from the concentration composition profile based on the isoconcentration surface containing more than 6 at.% Li was estimated to be is (13±1) at.% Li, (11±1) at.% Cu, (3±1) at.% Mg and (1.5±0.4) at.% Ag.