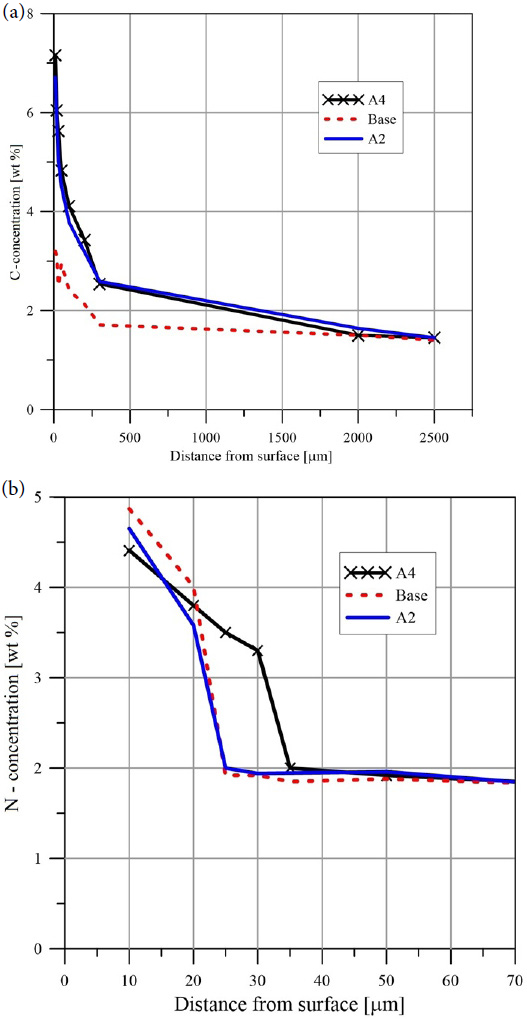
Figure 6:
C (a) and N (b) concentration EDS profiles detected in the components after different thermochemical treatments.