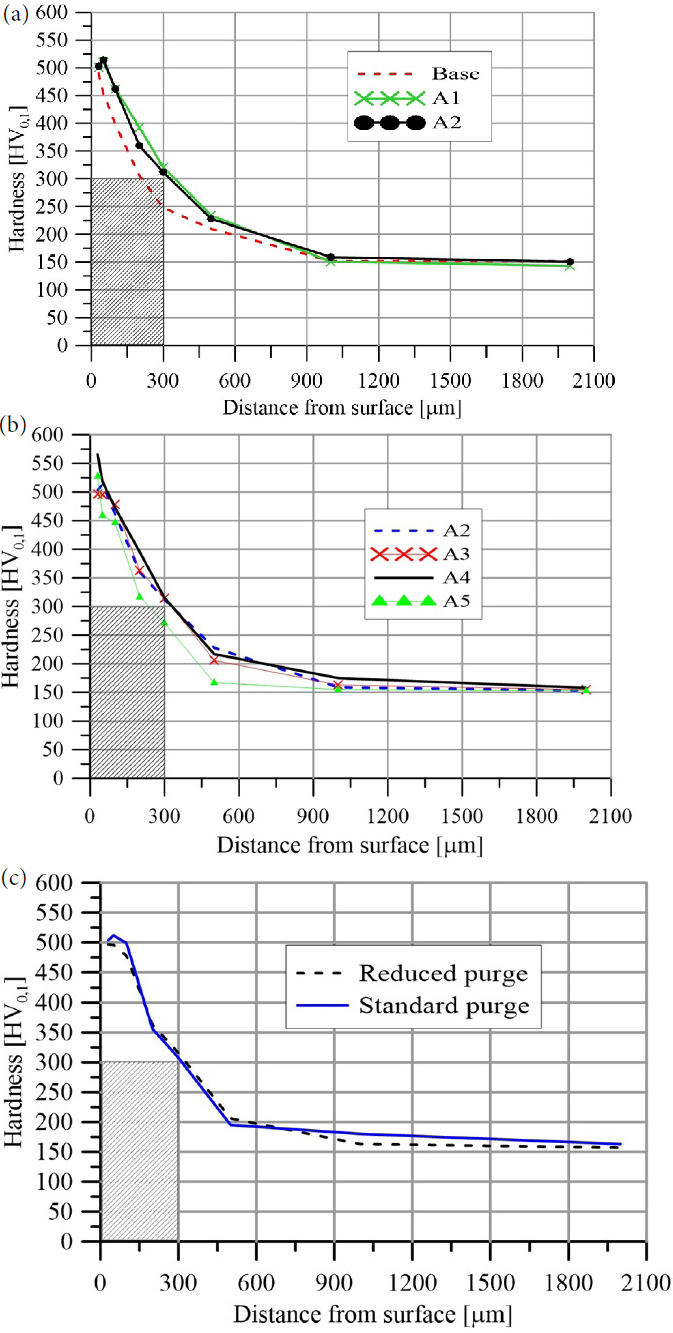
Figure 3:
Microhardness profiles after different nitro-carburizing treatments. The graphs show the effects due to (a) different nitrocarburizing conditions, (b) different nitriding conditions and (c) different purging times.