Figure 11:
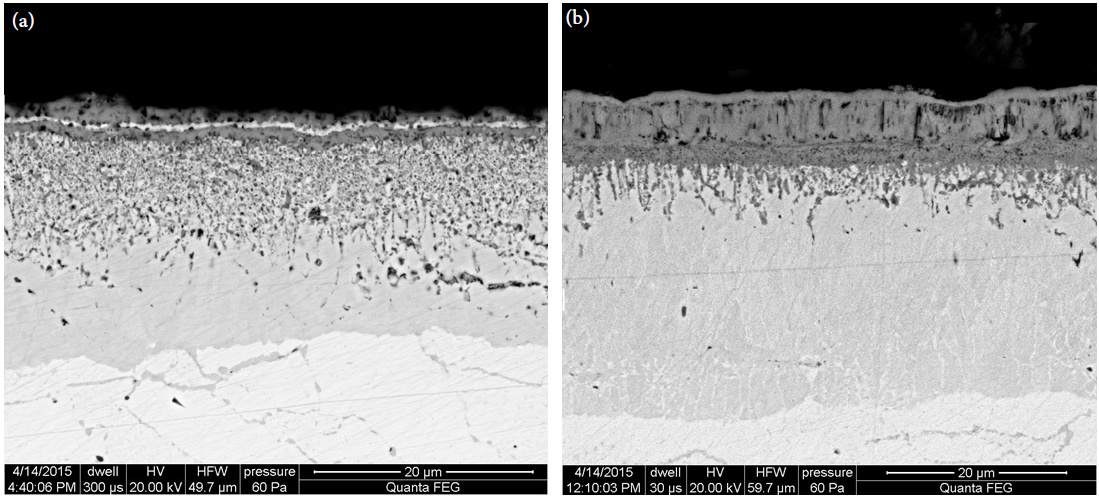
FEG-SEM microstructure taken from the surface cross-section of two specimens treated with the (a) base process and (b) the optimized oxynitrocarburizing cycle shown in
Figure 10
.