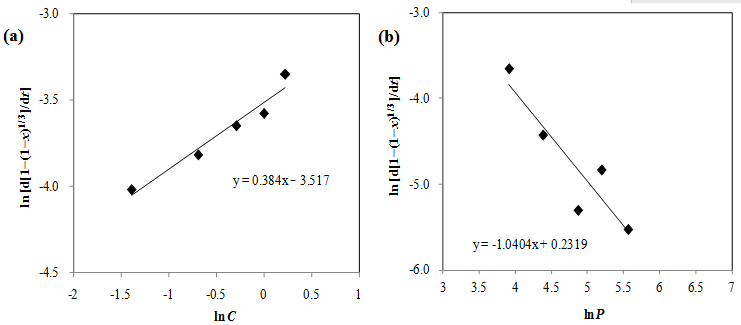
Figure 9:
Relation curves between ln[d[1–(1–x)
1/3
]/dt] and lnC, as well as lnP (a) TCA concentration; (b) Particle size.