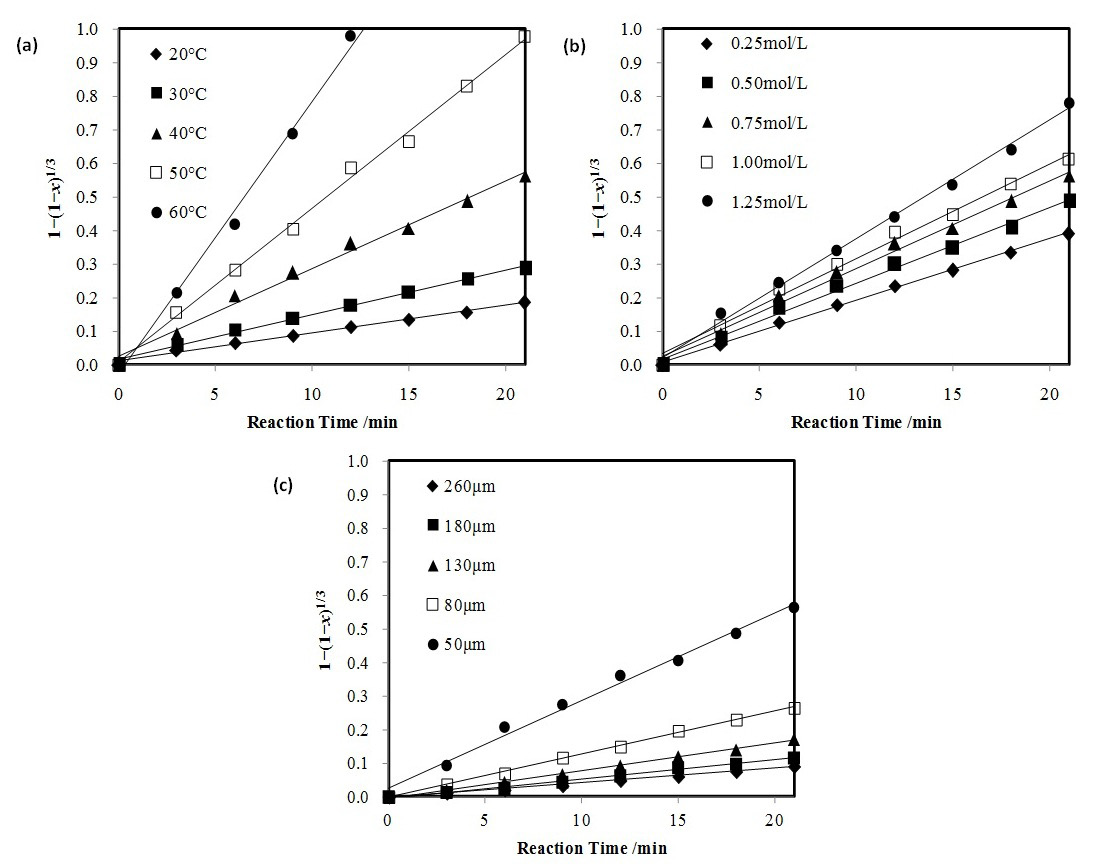
Figure 8:
Relation curves between 1–(1–x)
1/3
and time t under different influencing factors: (a) Temperature; (b) Reagent concentration; (c) Particle size.