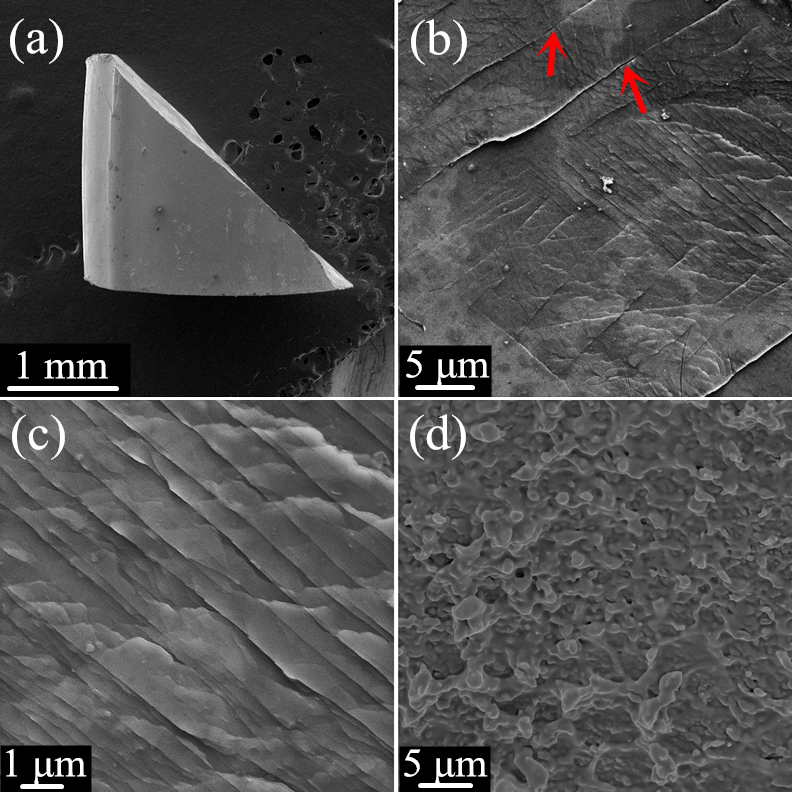
Figure 4: The fractographs of the composite upon quasi-static compression. (a) The lateral surface of the whole deformed composite; (b) the magnified image for the lateral surface of the deformed sample, multiple shear bands and several microcracks, indicated by the red arrows, can be seen; (c) dense shear bands with a spacing of 0.8 μm; (d) the fracture surface of the composite.