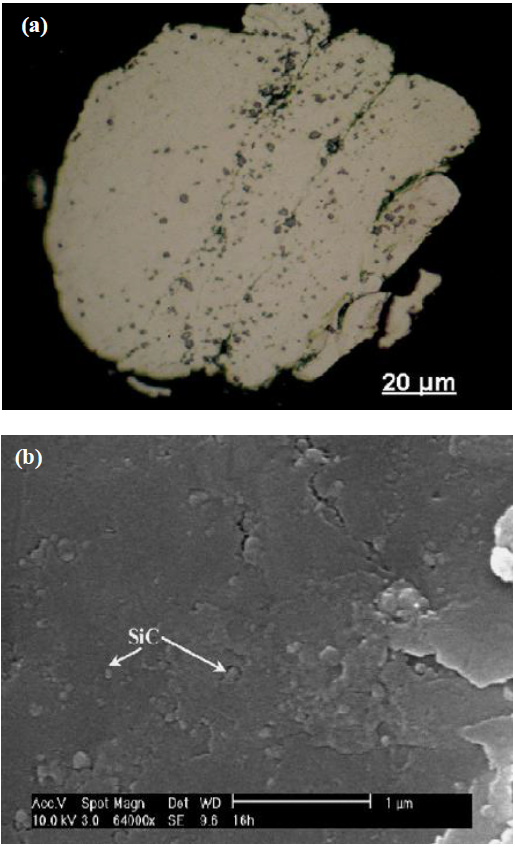
Figure 10:
Optical (a) and SEM (b) micrograph shows the distribution of SiC particles in the Al matrix after 14h mechanical milling.