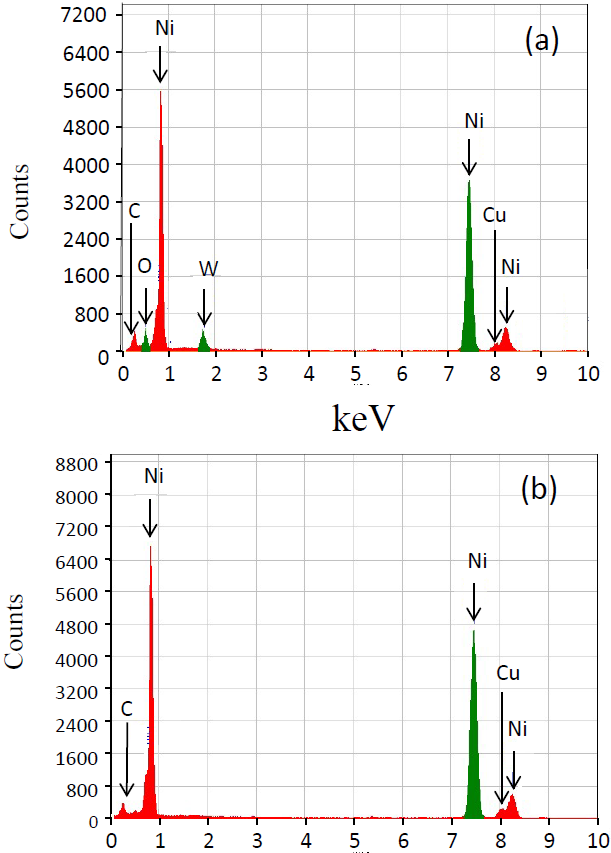
Figure 3:
EDS spectrum by spot analysis on the particle indicated by arrow a, and b the area indicated by arrow b.