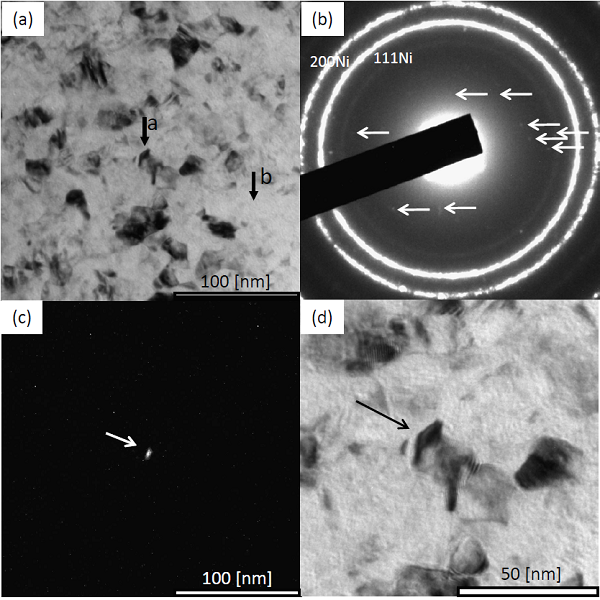
Figure 2: TEM micrographs; a bright-field image of nanocrystalline Ni-WO3, b diffraction pattern of both Ni and WO3. Arrows indicate diffraction spots identified as tetragonal WO3, c dark-field image of the same area activated by 110 point indicated by the arrow in Figure 2b,2d bright-field image in higher magnification of marked area of c.