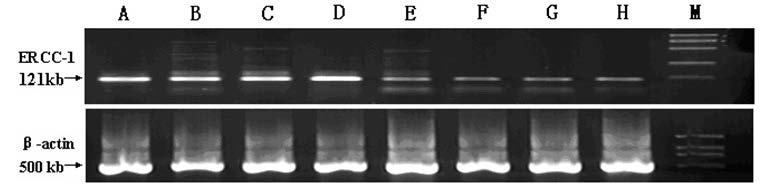
Figure 6: The ERCC1 mRNA expression level of SGC-7901 cells. Lane A,B: control group, lane C,D: treated with 1mg/L cisplatin, lane E,F: treated with 0.5μmol/L ZLLFC and 1mg/L cisplatin, lane G,H: treated with 1μmol/L ZLLFC and 1mg/L cisplatin. The optical density values of lane C,D was much higher than that of lane A,B, P<0.01; The optical density values of lane E,F,G,H, were significantly lower than those of cisplatin group P<0.01;there was no statistical difference between the two combined groups, P>0.05.