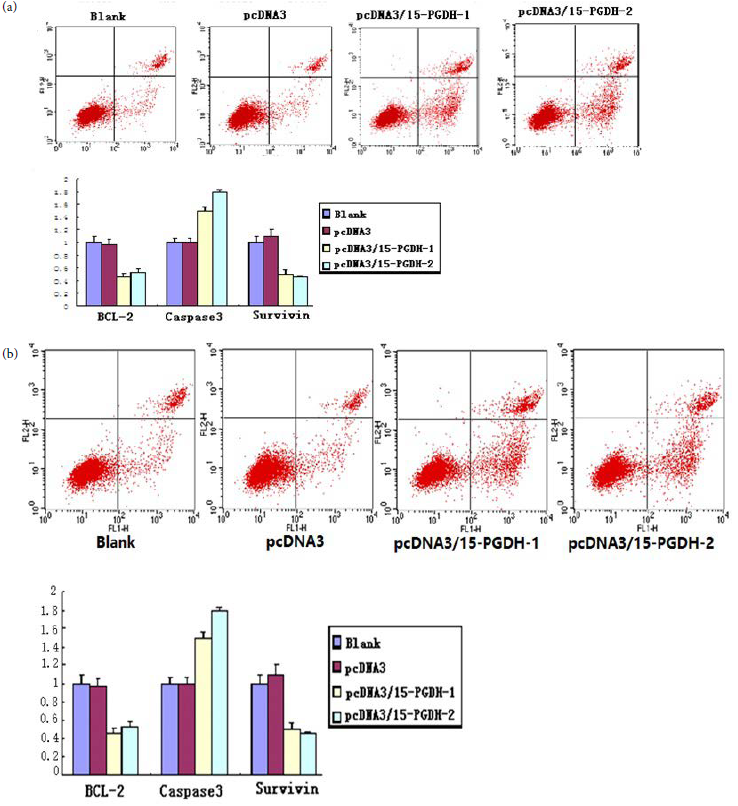
Figure 4:
(a) Flow cytometry analysis of gastric cancer cell apoptosis. (b) levels of p53, caspase3 and survivin mRNA expression in SGC7901(pcDNA3/15-PGDH-1 and pcDNA3/15-PGDH-2 groupsvs. other groups, p<0.05).