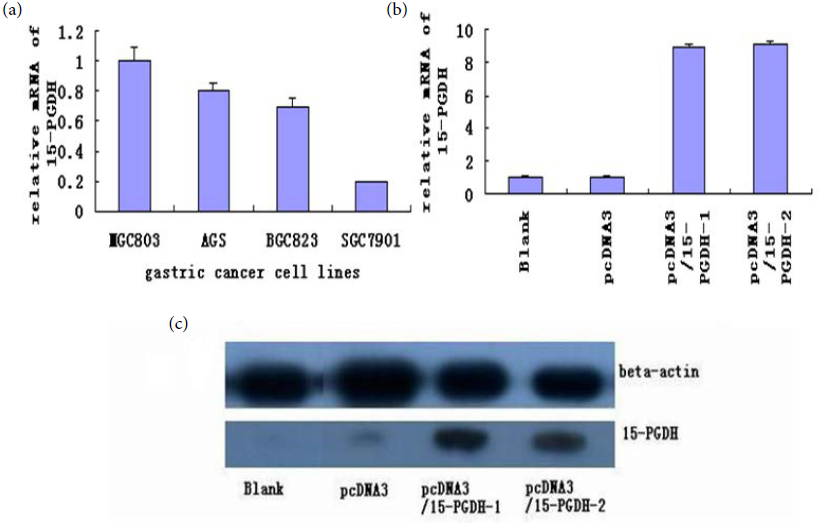
Figure 1: (a)Comparison of 15-PGDH mRNA expression in four gastric cancer cell lines (MGC803, AGS, BGC823, SGC7901).(b)Comparison of 15-PGDH mRNA expression in SGC7901 cells in four experiment groups. (c) Comparison of 15-PGDH protein expression in SGC7901 cells in four experiment groups. The expressions of 15-PGDH mRNA and 15-PGDH-1 protein were much higher in pcDNA3/15-PGDH-1 and pcDNA3/15-PGDH-2 groups than in blank and pcDNA3 groups (P<0.05). β-actin (~43 kDa) expression was used as an internal control to quantify 15-PGDH expression (~29 kDa).