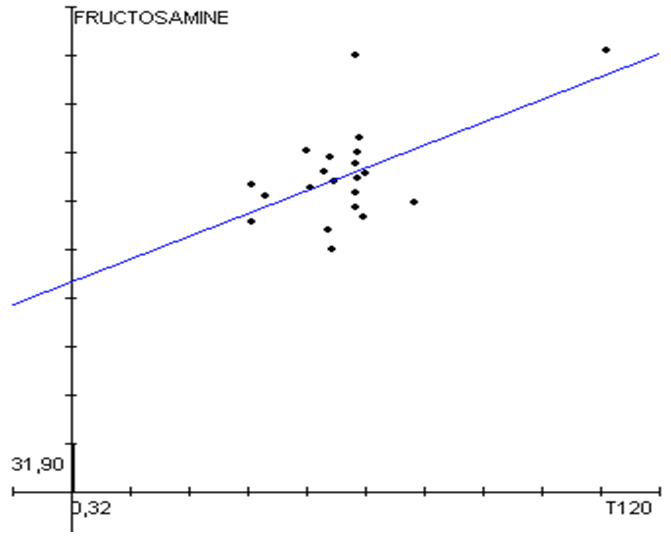
Figure 9: Correlation glycaemia T120/ Fructosamine: we notice on the figures above that the clouds of points representing the glycaemia at T0, T60 and T120 are dispersed and the curve of fructosamine crosses only 2 of these points. Correlation coefficient: r = +0,42 non exposing and p= 0.52 not significant.