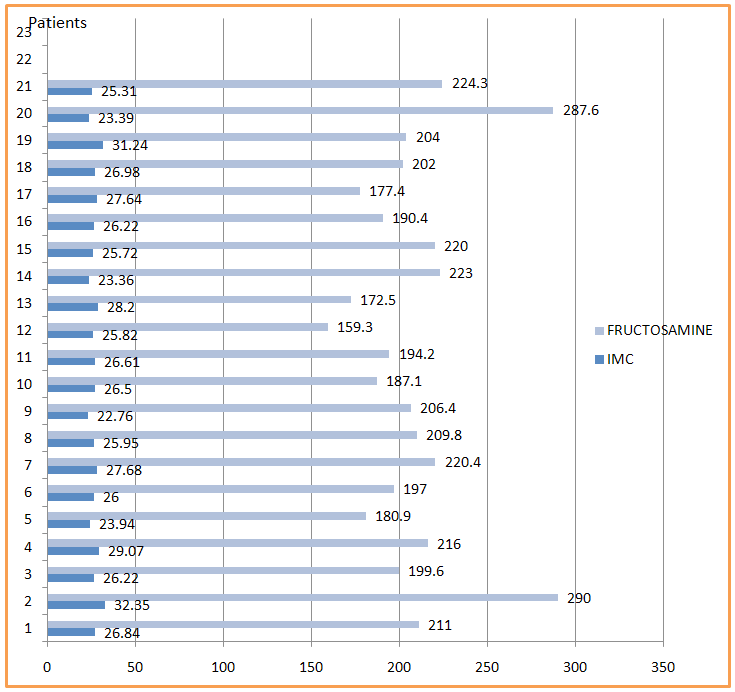
Figure 6: Relation between Fructosamine and BMI.
For this figure patients 2 and 20 who have elevated fructosamine level; 290μmol/L et 287,3μmol/L, have different BMI, elevated for the first who is obese 32.35kg/m2 and the second whose BMI is normal 23.39kg/m2. The patient with the lowest fructosamine level is overweight with a BMI of 25.82Kg/m2. the correlation coefficient r = -0,13. Correlation : OGTT/Fructosamine.
For this figure patients 2 and 20 who have elevated fructosamine level; 290μmol/L et 287,3μmol/L, have different BMI, elevated for the first who is obese 32.35kg/m2 and the second whose BMI is normal 23.39kg/m2. The patient with the lowest fructosamine level is overweight with a BMI of 25.82Kg/m2. the correlation coefficient r = -0,13. Correlation : OGTT/Fructosamine.