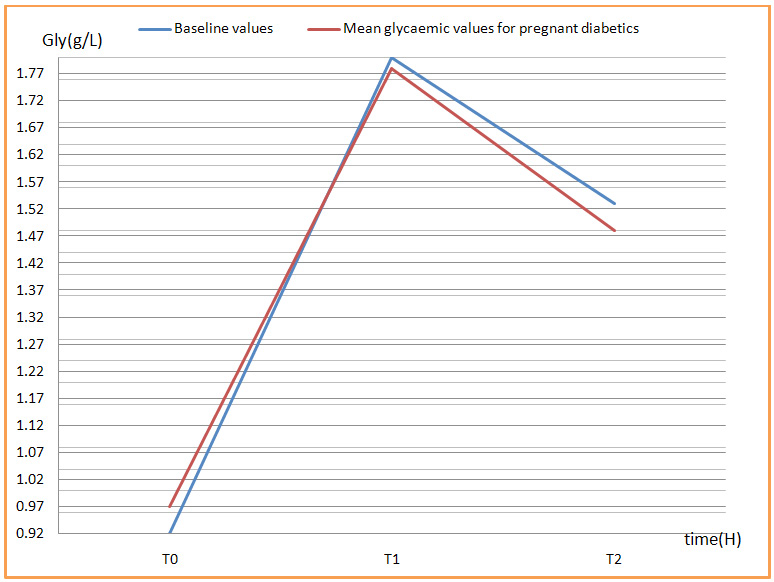
Figure 3: Oral glucose tolerance test (OGTT): Glycaemia values.
T0 = Fasting glucose value.
T1 = Glycaemia value 1hour after OGTT.
T2 = Glycaemia value 2hours after OGTT.
From our study population concerning OGTT, the mean glycaemia on this figure was 0.97 at T0 (fasting) which is superior to the baseline value; the mean glycaemia after OGTT was 1.78 at T1 and 1.48 at T2 respectively.