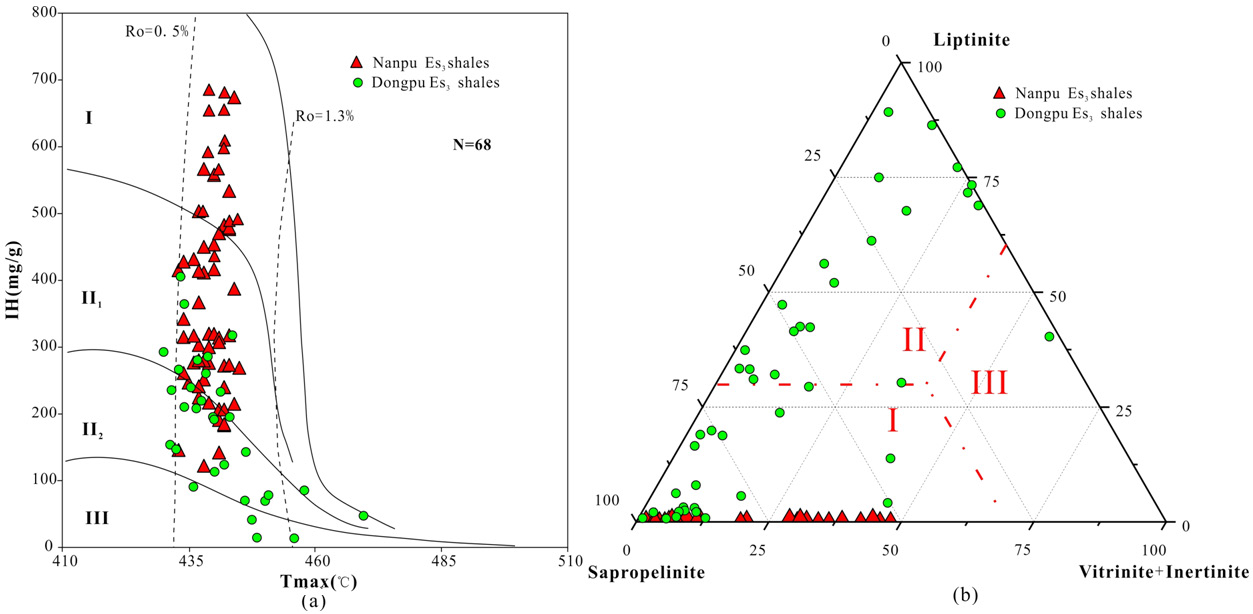
Figure 4:
Plots of hydrogen index (HI) versus Tmax (a) and kerogen macerals ternary diagram (b) for Es
3
shales in the Nanpu and Dongpu depressions.