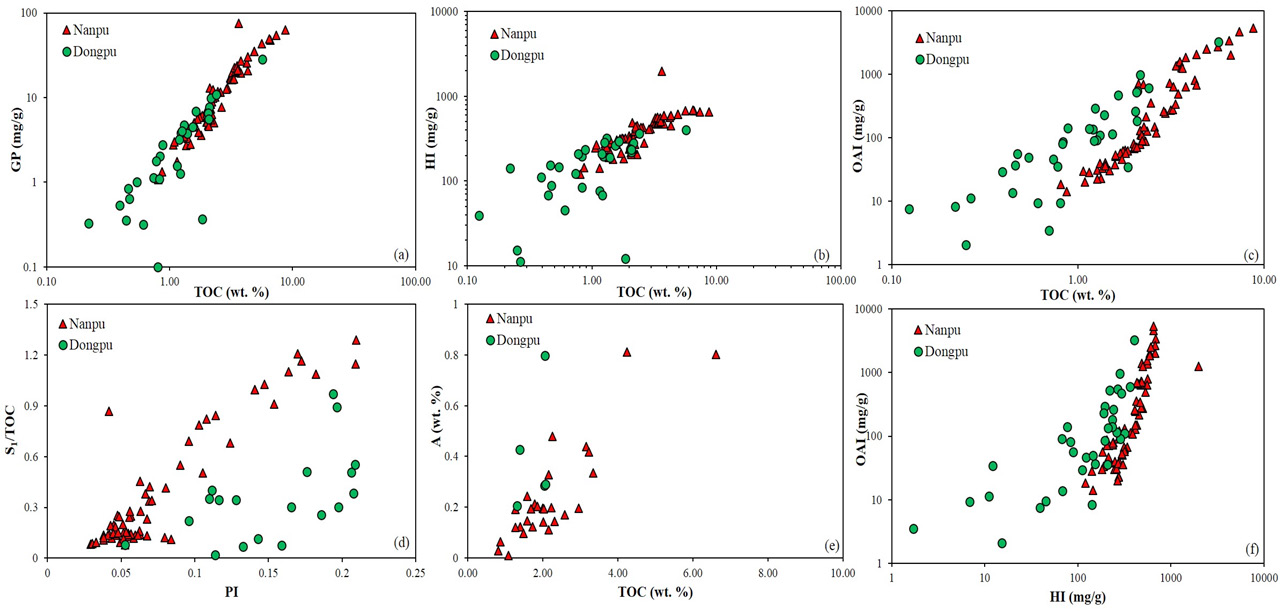
Figure 3: The comparison of the hydrocarbon potential of Es3 shales in the Nanpu and Dongpu depressions.
(a), (b), (c), and (e) show the relationships of GP, HI, the shale oil accumulation index (OAI; [44]) and chloroform bitumen “A” content with TOC, respectively. PI=S1/(S1+S2). (d) shows the correlation between S1/TOC and PI. (f) shows the Relationships of OAI and HI index.
(a), (b), (c), and (e) show the relationships of GP, HI, the shale oil accumulation index (OAI; [44]) and chloroform bitumen “A” content with TOC, respectively. PI=S1/(S1+S2). (d) shows the correlation between S1/TOC and PI. (f) shows the Relationships of OAI and HI index.