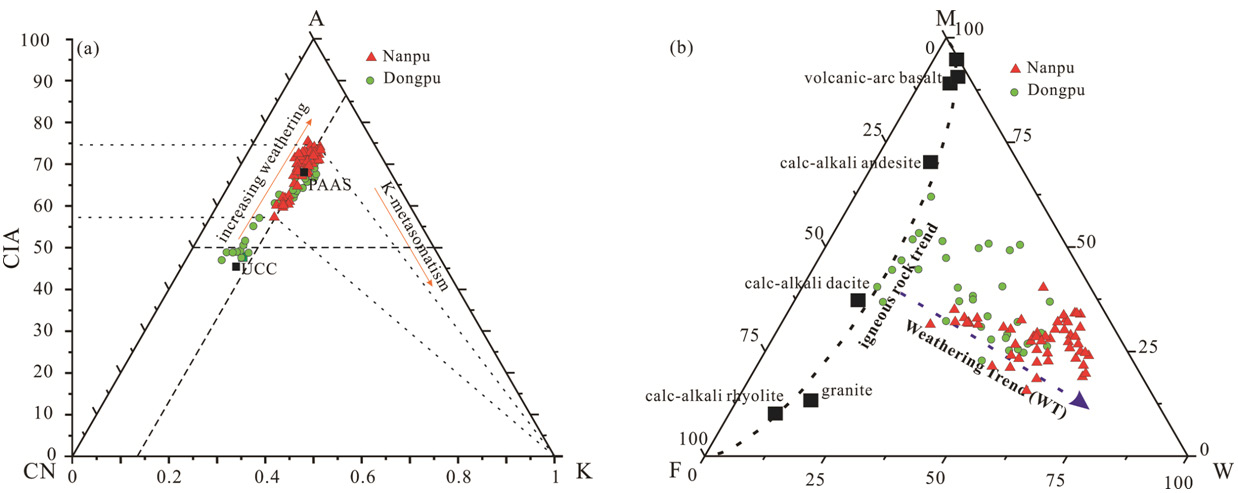
Figure 10: The comparison of geochemical weathering trends of the Es3 shales in the Nanpu and Dongpu depressions.
(a) A-CN-K (Al2O3-CaO* + Na2O-K2O, all in molar proportions) ternary diagram. UCC, upper continental crust; PAAS, post-Arche an Australian shales [71]. (b) Weathering trends of the Es3 shales depicted on the M-F-W diagram [86]. The black dashed line represents a compositional linear trend for igneous rocks
(a) A-CN-K (Al2O3-CaO* + Na2O-K2O, all in molar proportions) ternary diagram. UCC, upper continental crust; PAAS, post-Arche an Australian shales [71]. (b) Weathering trends of the Es3 shales depicted on the M-F-W diagram [86]. The black dashed line represents a compositional linear trend for igneous rocks