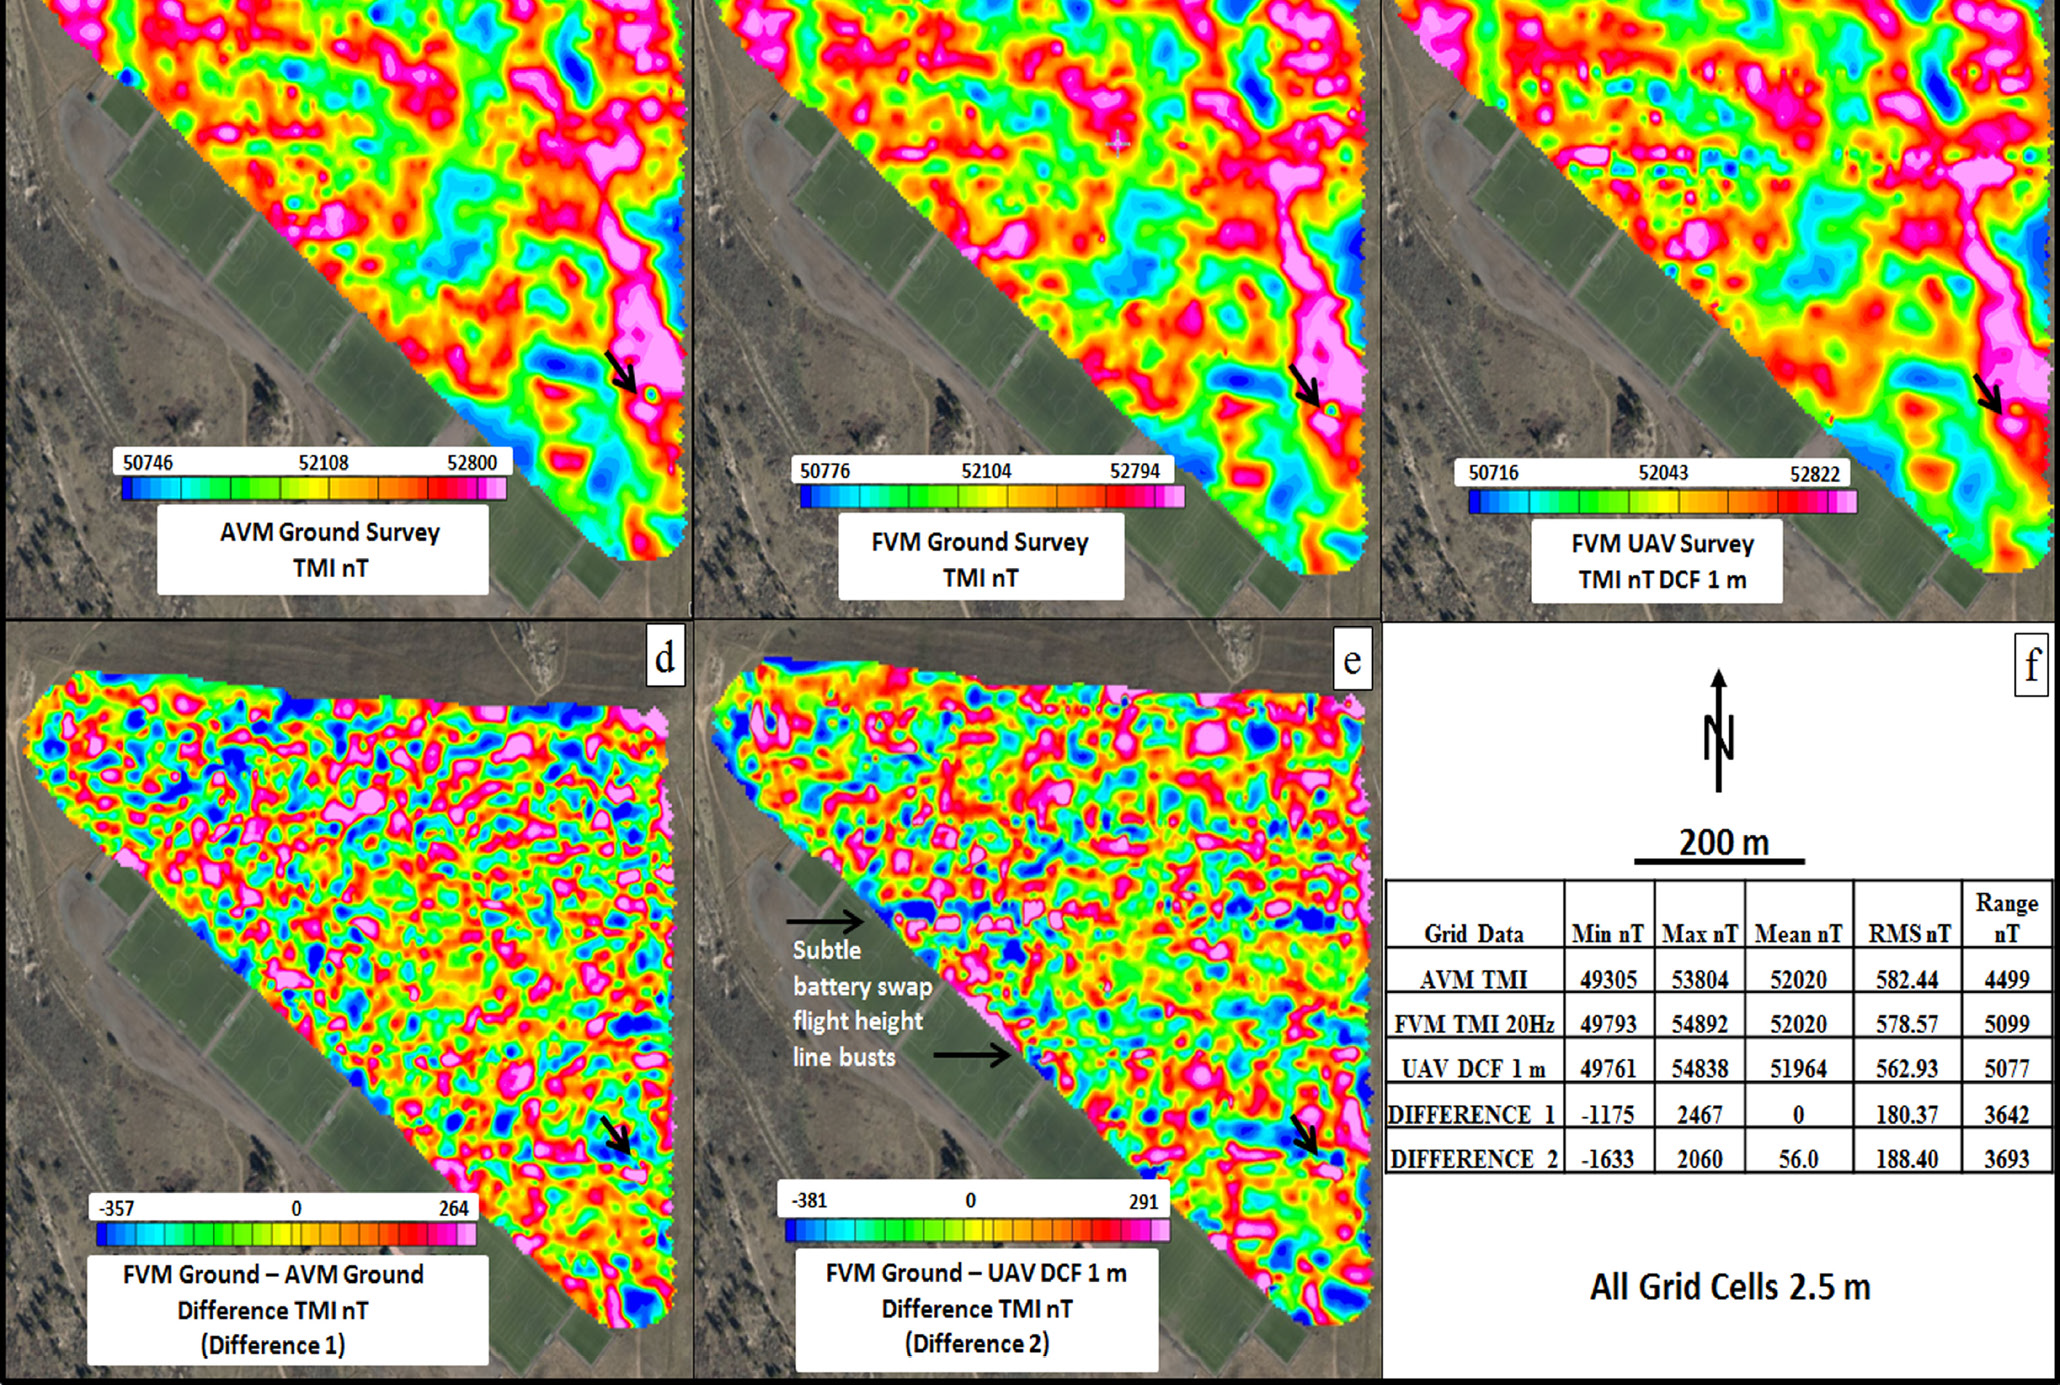
Figure 8: The AVM benchmark and FVM surveys gridded data. The corrected ground AVM, FVM and corrected UAV FVM DCF 1 m grid images are seen in (a), (b) and (c) respectively, with the FVM ground – AVM ground, FVM ground - UAV DCF 1 m difference grid images seen below in (d) and (e) respectively. The black arrows on the SE of all grids point out a common dipole. The five grids’ data statistics are in (f); all grids are comprised of 2.5 m square cells. All data is TMI in nT.