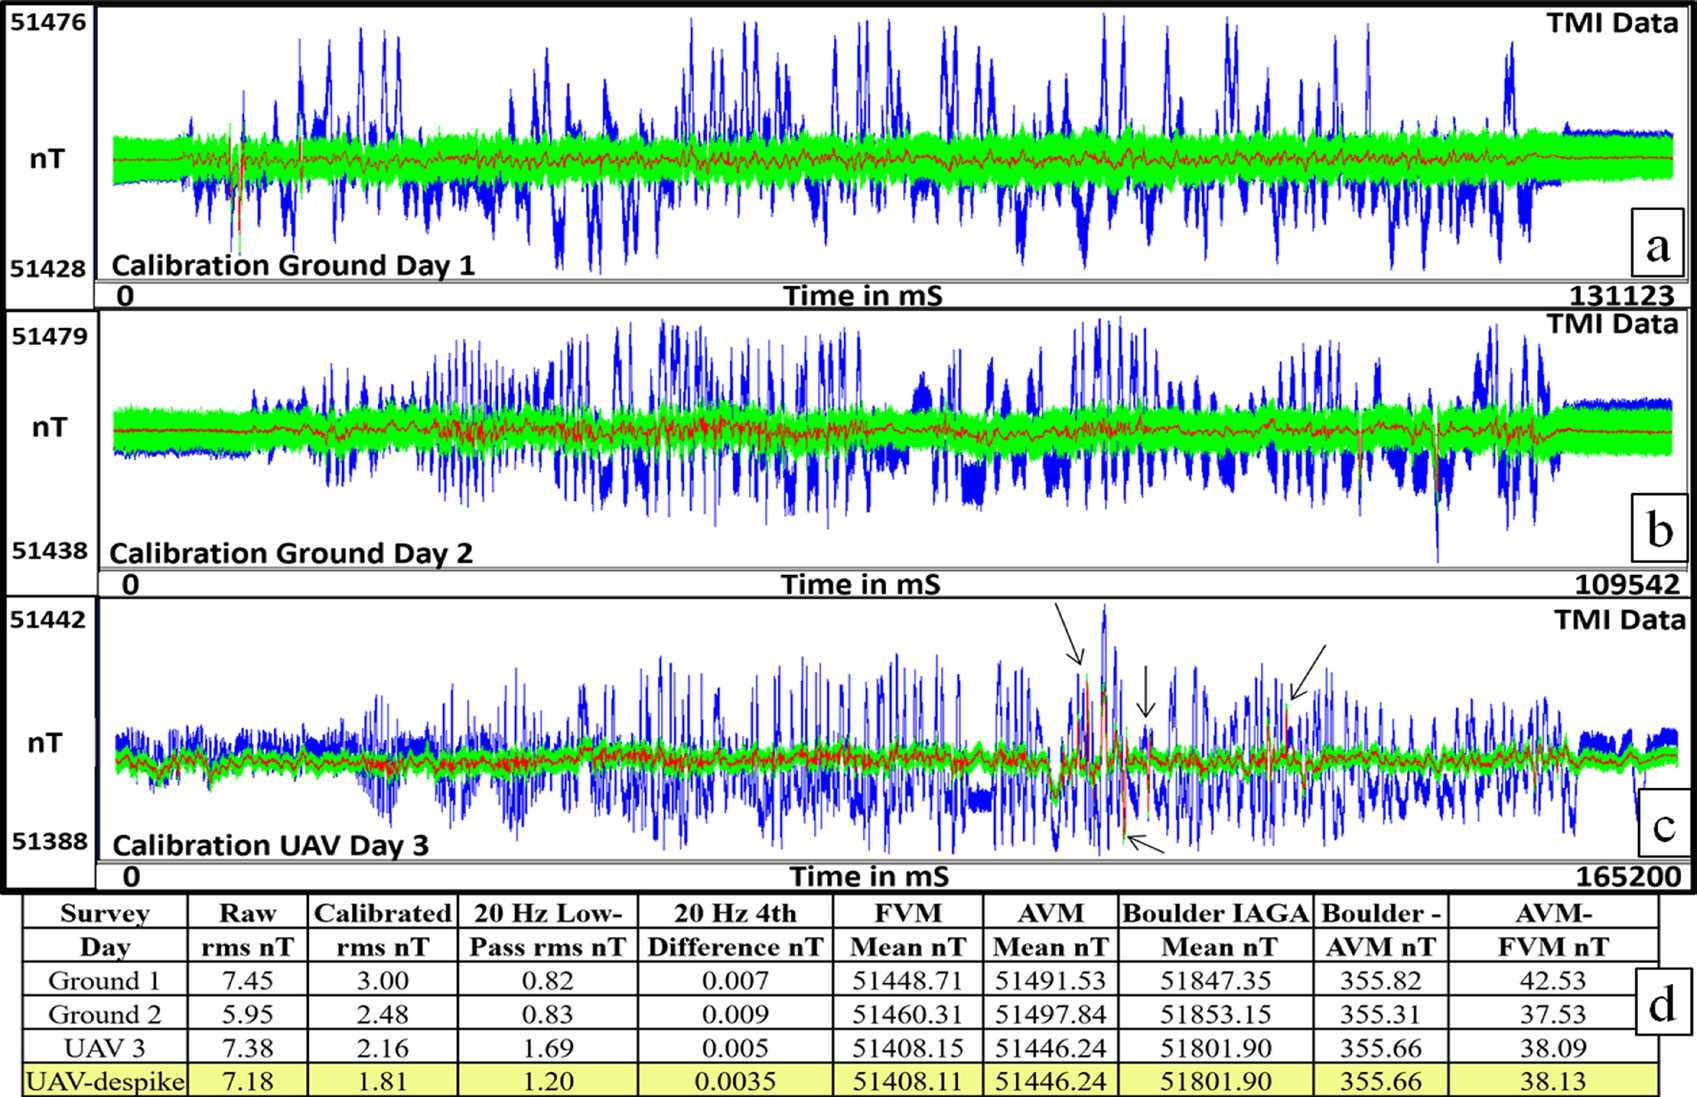
Figure 6: FVM calibration data: (a), (b) and (c) are the ground days 1, 2 and UAV day 3 raw, corrected and 20 Hz low pass profiles in blue, green and red respectively. The arrows in (c) point out a few UAV day spurious noise spikes, the de-spiking results are listed in (d) the calibration data table yellow row. The table column heading abbreviations are: IAGA = International Association of Geomagnetism and Aeronomy, -AVM and -FVM: the dash in the last two columns is a subtraction sign. The profiles above the table are FVM only, the AVM and IAGA table numbers indicate FVM diurnal stability for the three days. The FVM table numbers in (d) are TMI in nT.