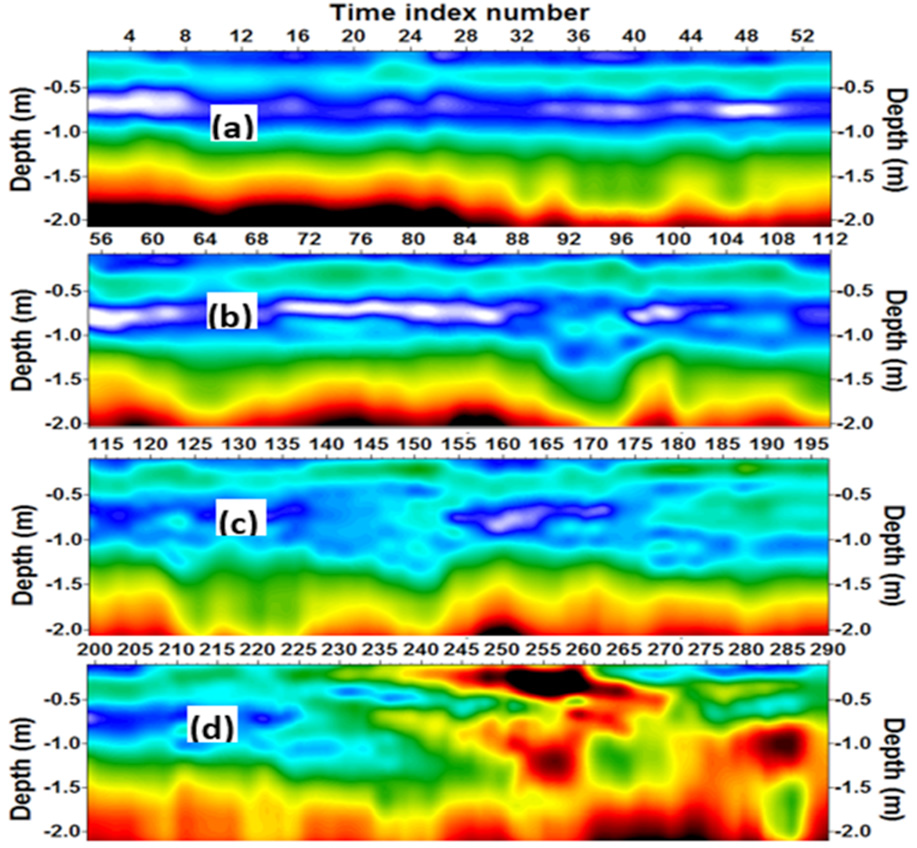
Figure 8:
The temporal variations of the S-wave velocity images obtained in (a) Nov.-Dec., 2011 (b) Feb.-Mar., 2012, (c) Apr.-May., 2012, and (d) Jun.-Jul., 2012.