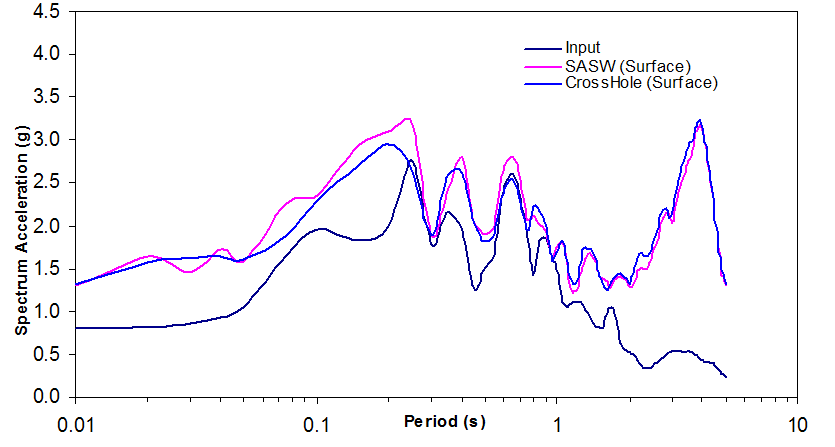
Figure 18:
Sa spectra (5% damping) for Deep Soil profile , SASW (pink line) and CH(blue) models using M=7.1 input synthetic motion (black line).