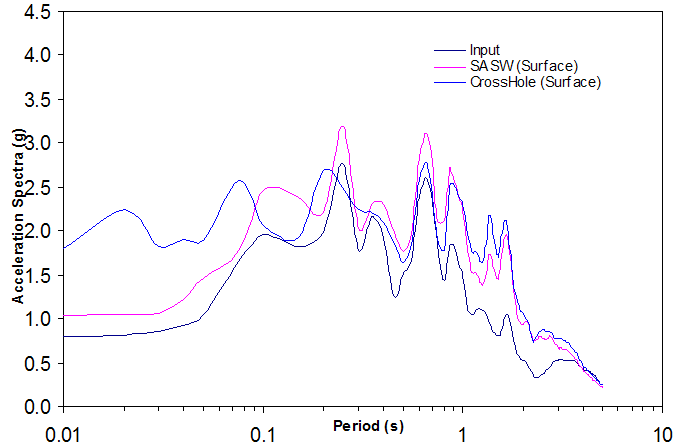
Figure 17:
Sa spectra for Shallow (hypothetical) Soil Profile ~60m for the SASW(pink line) and CH (blue line) models using M=7.1 input synthetic motion(black line).