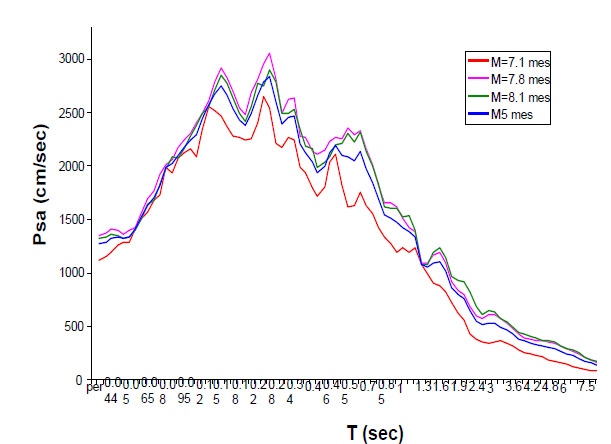
Figure 15:
Comparison of average Sa spectra for 3 combinatons of M
w
and D (km).