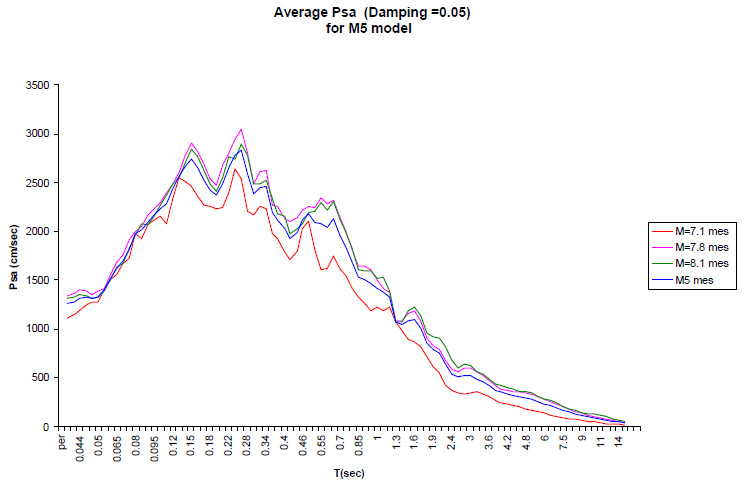
Figure 10:
Comparison of average Sa spectra for 3 combinations of M w and D (km) for M5 model (bridge site A).