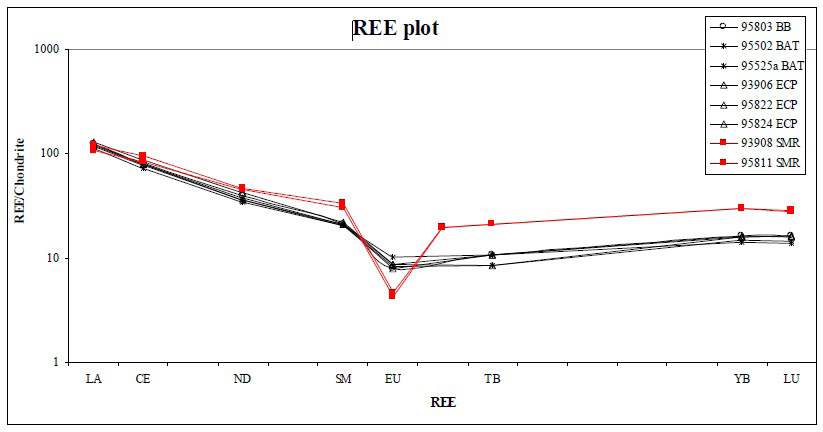
Figure 7:
Chondrite normalized REE distribution diagram. (12 Chondrite, symbols as Figure 6. (Note: Gd was not analyzed. Gd values extrapolated from HREE trend
[22]
).