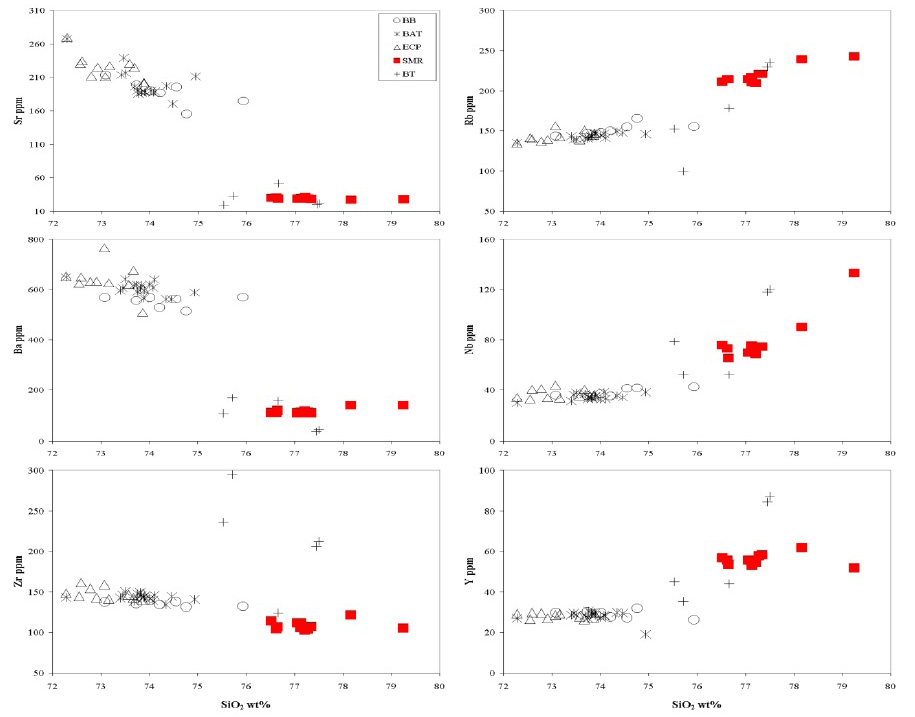
Figure 6: Sr, Ba, Zr, Rb, Y, and Nb versus SiO2 showing whole-rock variation between ECS, SMR, and BT. Sr, Ba, and Zr show negative trends with increasing SiO2; Rb, Nb and Y have slight positive trends in ECS. SMR has different trends compared with those of the ECS. (Symbols as in Figure 6).