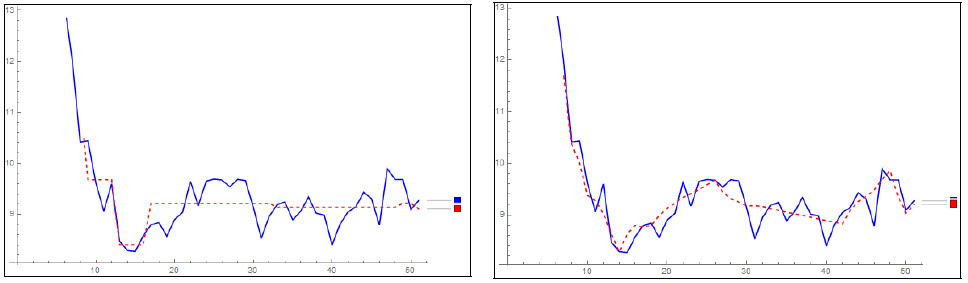
Figure 8:
A closer view for the simulations using Haar and Daubechies wavelets thresholds, respectively.