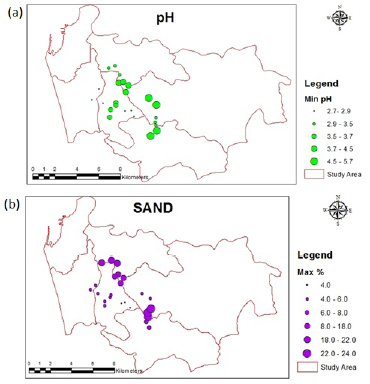
Figure 7:
Distribution of (a) pH value and (b) sand percentage along the main marsh in the study area.