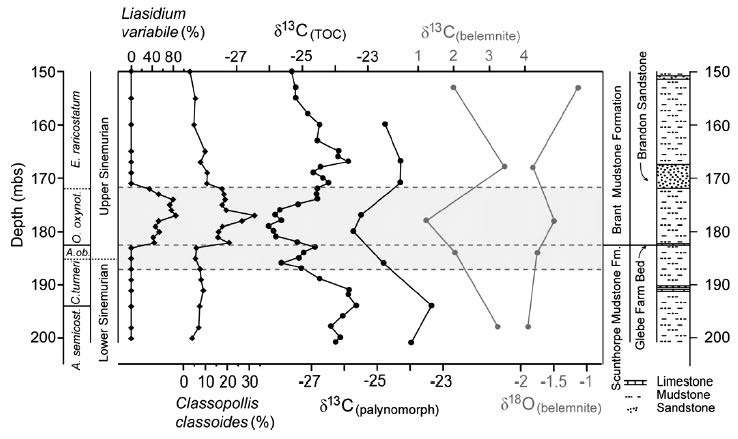
Figure 3: Early Jurassic, Sinemurian substage (Great Britain) (Riding et al., 2013). The light grey shading indicates the extent of the “greeenhouse effect”. Two first curves show the occurrence of thermophylic organisms Liasidium variable and Classopollis classoides (the data are expressed as percentages of the entire marine palynofloras). Two next curves show the changes of carbon isotope composition of the studied types of polynoforms.. Two last curves show the changes of carbon and oxygen isotope composition of the belemnite carbonates at the considered time.