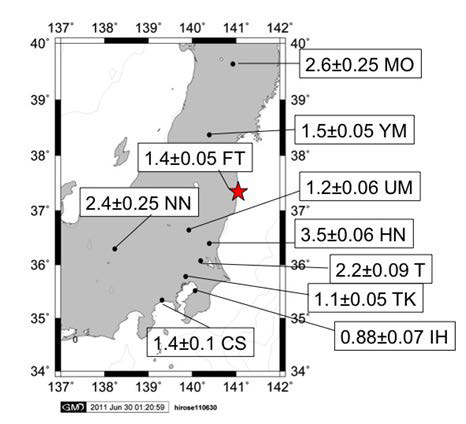
Figure 3:
Spatial distribution of the
90
Sr/
137
Cs activity ratios in deposition samples collected in March 2011. (Unit: × 10
-4
).