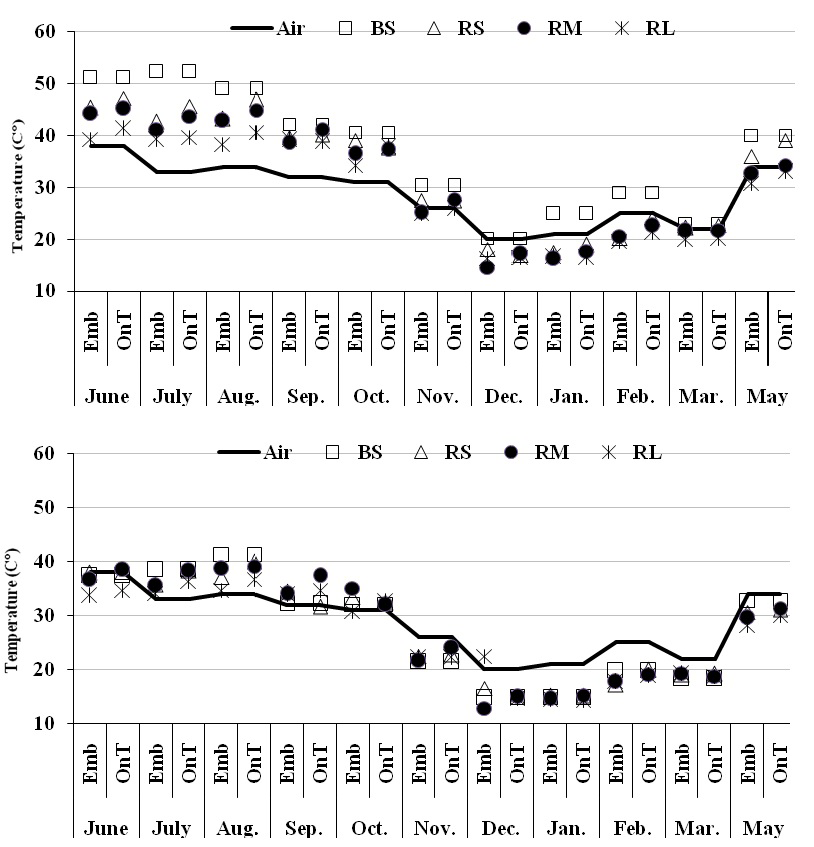
Figure 2:
Air and soil temperature variations of the various microenvironments during one year (June 2006-May 2007). Each point represents a mean of 20 measurements.