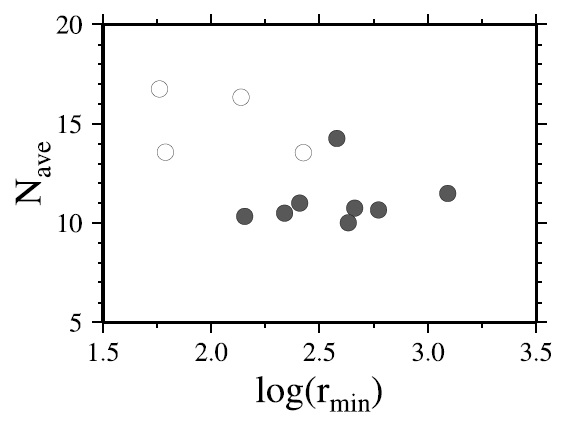
Figure 6:
Diagram showing the average number of neighbours (N
ave
) at the smallest length scale of the data (
r
min
) versus the log
r
min
. The open circles indicate the broadband events, while the filled ones the chugging events.