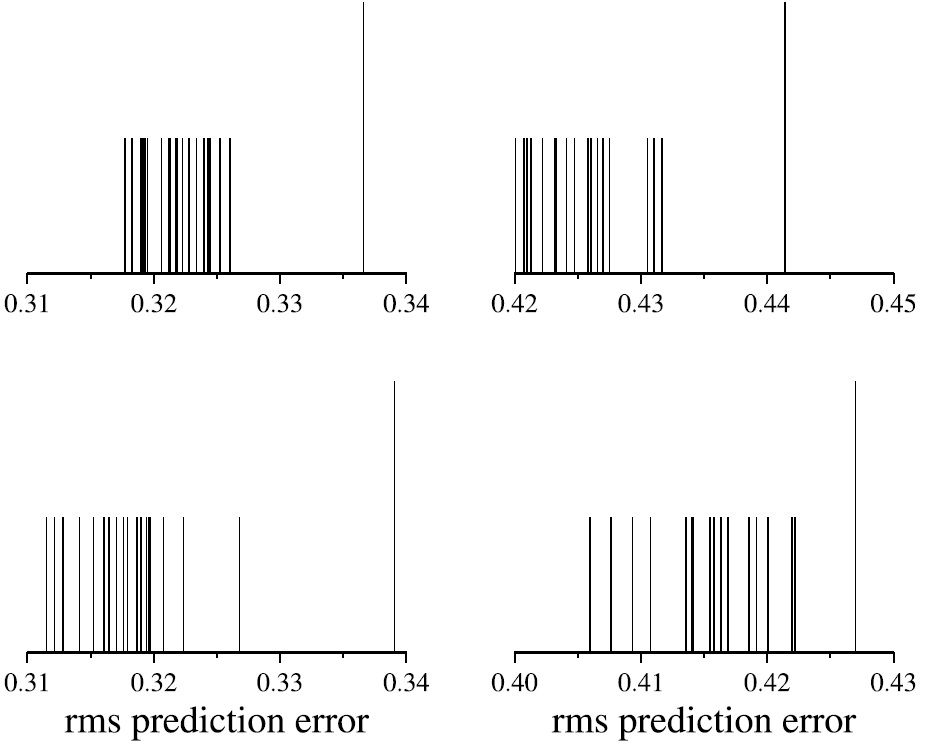
Figure 3:
Results of the application of the surrogate data test to the four broadband events considered in this study. The long spike in each diagram represents the original data, while the short one each of the 19 surrogates.