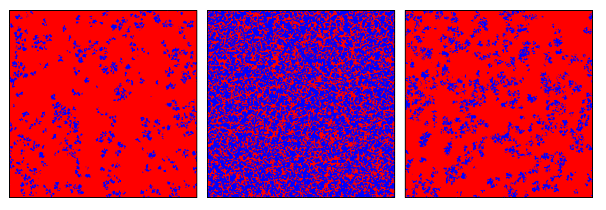
Figure 5: The spatial distribution of the cooperators (the blue squares) and of the defectors (the red squares) on the spatial grid 400 x 400 considering the temptation to defect b = 1.04 and different values of K. Small K = 0.01 on the left panel, medium K = 0.35 on the middle panel and high K = 2 on the right panel. Share of cooperators in the each panel shows that it is optimal at the medium K, when the share of cooperators is the largest = 0.619, while the share of cooperators at low K is = 0.091 and at large K is = 0.148.